Testing Binky Points
Using the newly added double dummy solver in Deal, I've been able to regenerate the Binky Points data using more double dummy data, and specifically generate enough data for very rare patterns like 9-4-0-0 and the longer suit holdings.
I ran the data through a seperate set of double dummy data (100,000 deals) and got the followng results:
| Binky-Tricks | Deviation | |
|---|---|---|
| Suit contract | 0.005 | 0.99 |
| Notrump contracts | 0.001 | 1.26 |
This means that on average, the difference between Binky Points and actual tricks is very close to zero. This really is not too surprising - some really stupid evaluators have this feature. For example, the two constant evaluators:
     suit(hand) = 4.21
       nt(hand) = 3.03
The real question is the deviation.
For example, with the 'dumb' evaluator listed above, the standard deviation is 2.11 in the suit contract and 2.78 in notrump.
Binky Point deviations are better than that, but they still seem a bit high. However if you realize that trick values are always integers, then we see that the values that are within one deviation of the suit Binky Points value are the two nearest integers. So if two hands are valued at 10.4 suit tricks, then 10 and 11 are the only values for Tricks which are within one standard deviation. In notrump, you might have three integers within a standard deviation of the two hand values.
So quite often, Binky is a very good approximation. And notice that Binky does not have any knowledge of the fit between the two hands.
The next simulation was to deal a pair of north/south hands, then deal N complete deals with those north/south hands and average the number of tricks for north/south over those N hands, and compare that average to Binky Points.
I chose N=20 for my first sample, and the results I got were:
| Binky-AvgTricks | Deviation | |
|---|---|---|
| Suit contract | 0.006 | 0.76 |
| Notrump contracts | 0.007 | 0.83 |
This reduces the deviation a bit.
By contrast, the 'dumb' constant evaluator above reduces its deviation to 1.95 in suit contracts and 2.59 in suit contracts in the same simulation.
Scatterplot Graphs
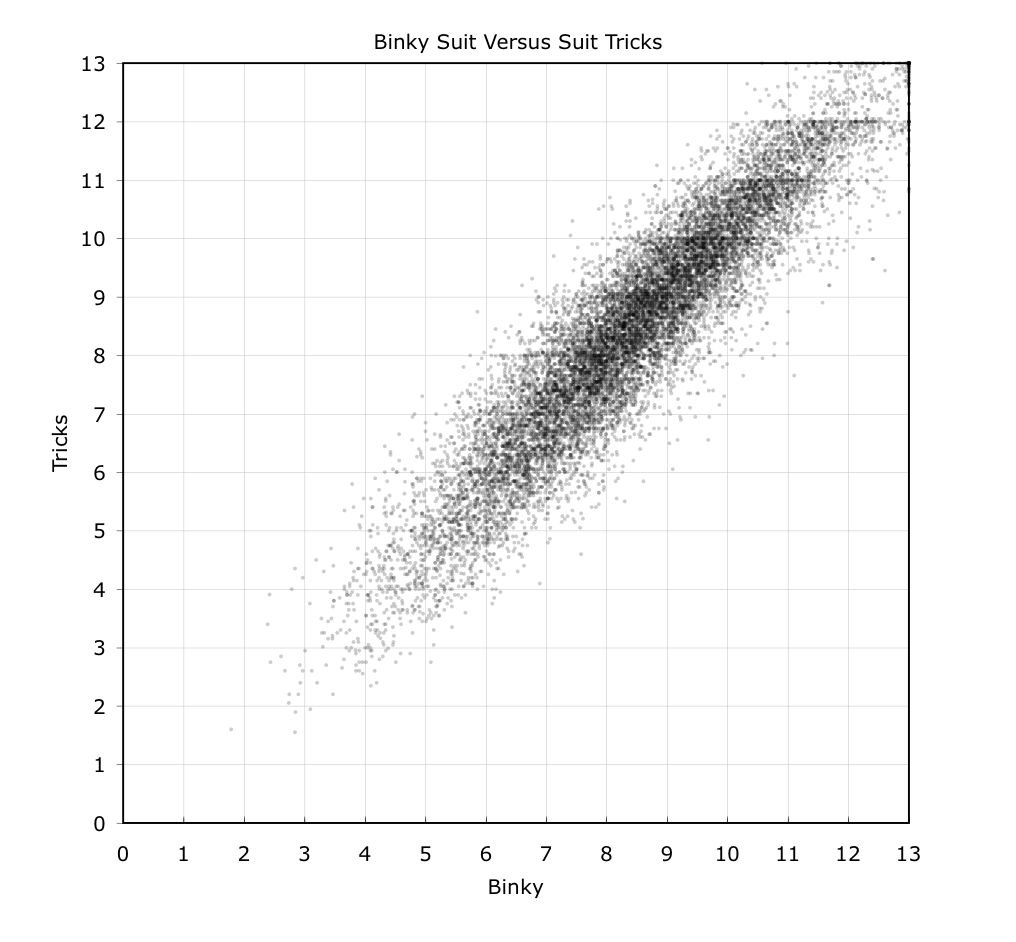
- Binky Suit vs. Actual Suit Tricks
- A graph of the relationship betwen the Binky Suit evaluator and the average of total real tricks. (So we deal north/south, then deal N deals with those north/south hands, and compute the average of the number of tricks available in a suit contract across those N hands. In this case, N=20.) The linear correlation in this data is 0.925.
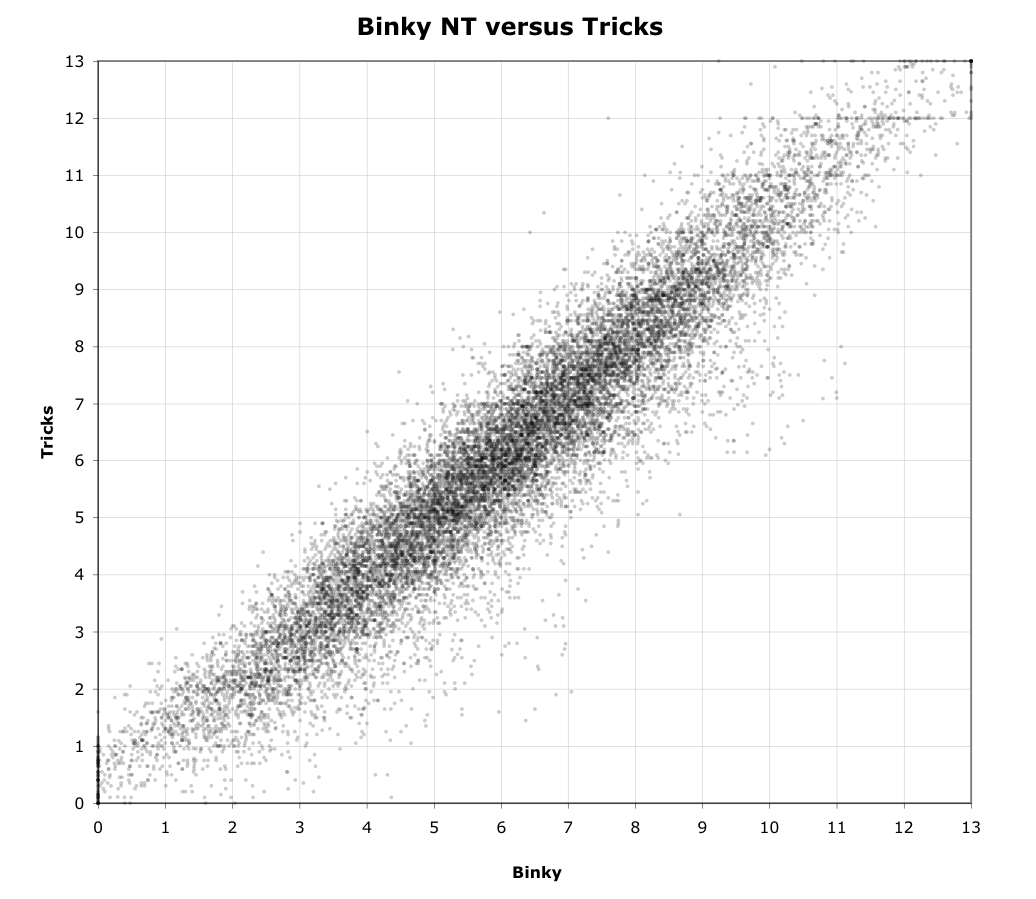
- Binky NT vs. Actual NT Tricks
- A graph of the relationship between the Binky Notrump evaluator for a pair of north/south hands and the average double dummy tricks the two hands can make in notrump. The linear correlation in this data is 0.947.
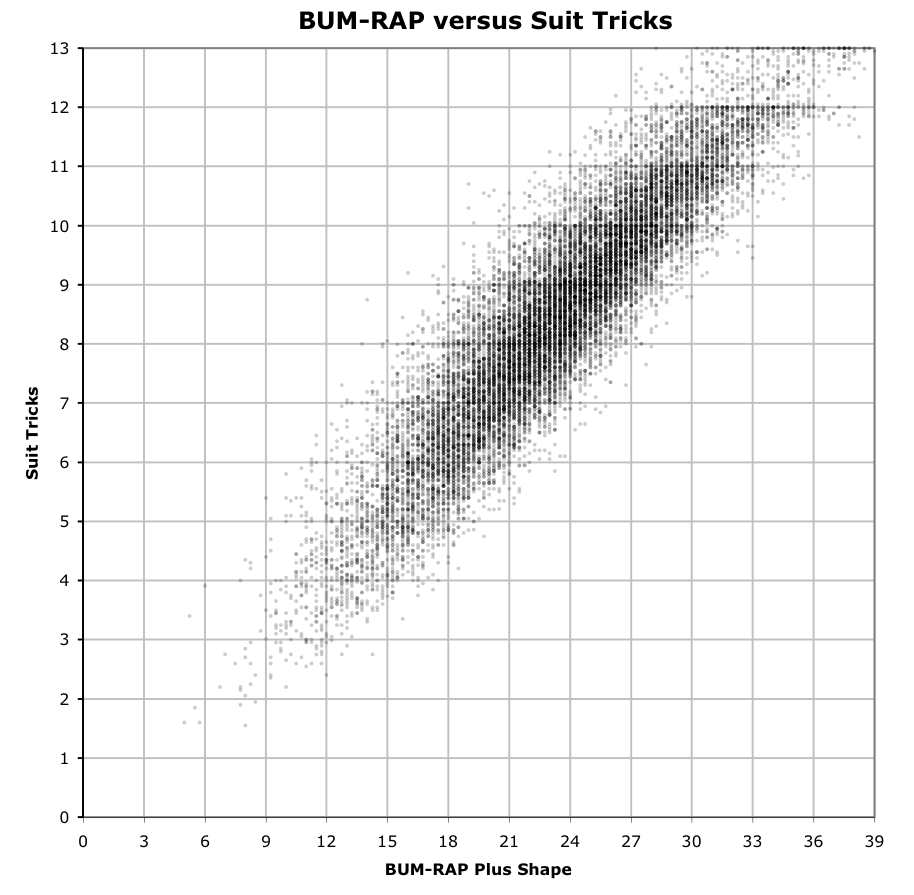
- BUM-RAP vs. Suit Tricks
- The relationship between BUM-RAP and the average number of suit tricks. BUM-RAP is Ace=4.5, King=3, Queen=1.5, Jack=0.75, and Ten=0.25. Void is three points, singleton two points, doubleton one point. This can be thought of as a refined 6-4-2-1 count. The linear correlation here is 0.914, which is a weaker relationship than Binky Suit.
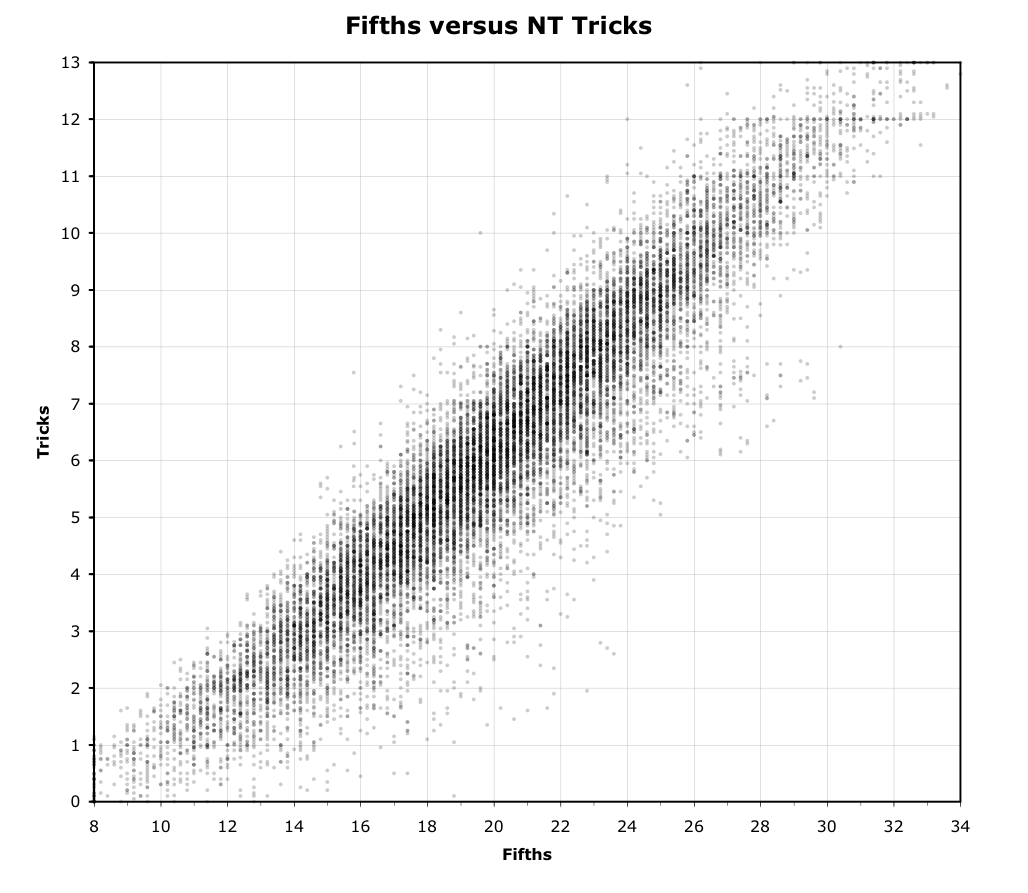
- Fifths Evaluator vs. NT Tricks
- Fifths evaluator is Ace=4, King=2.8, Queen=1.8, Jack=1, Ten=0.4. The linear correlation here is 0.931, which is a weaker relationship than Binky NT.
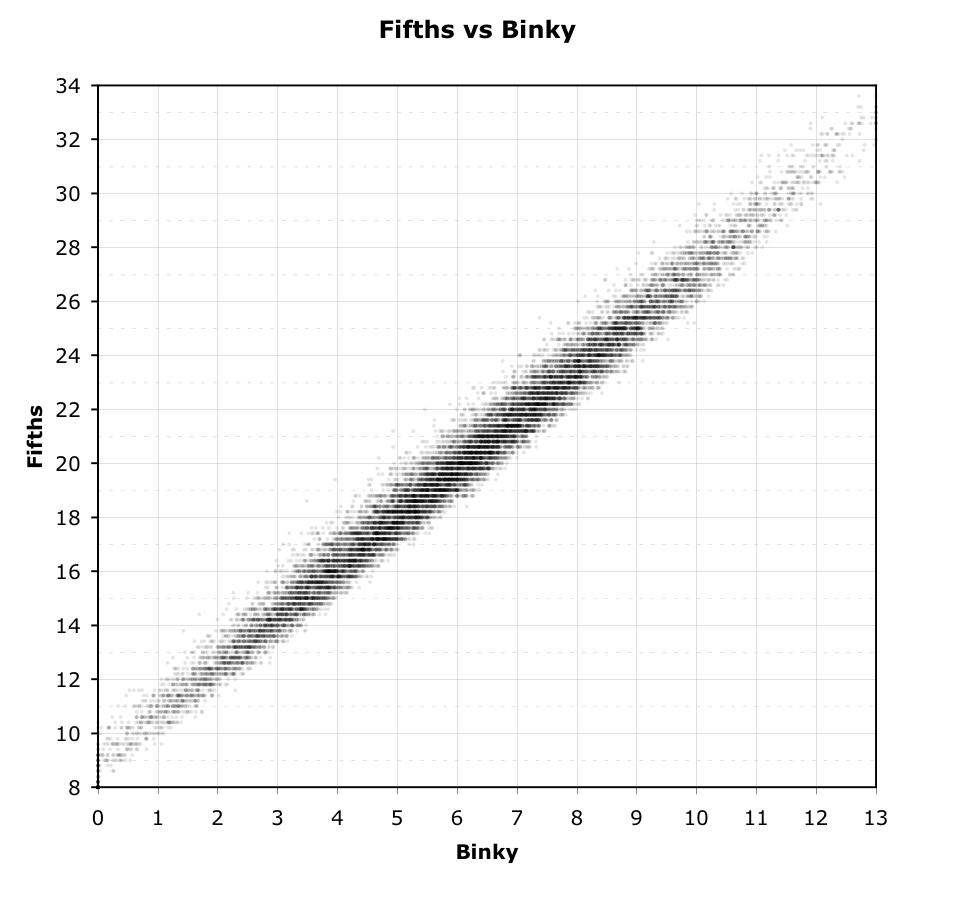
- Binky NT vs. Fifths
- You can see that these two values tightly correspond. Indeed, the correlation between these two is high: 0.982.